
Your Worksheet is Ready
CBSE Class 8 Maths Worksheet
Introduction To Graphs
Find the coordinates of the points at which this line meets x axis in the following graph.

Following pie chart represents the favorite desserts distribution.

What is the measure of the central angle(in degree) in the "Biscuits" section?
Following pie chart displays the number of students speaking different languages in a hostel.
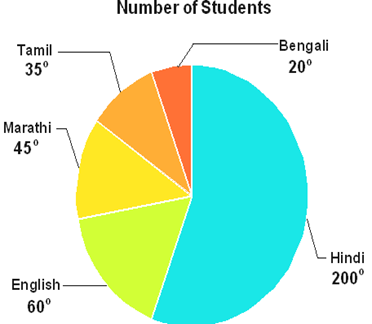
If the total number of students are 72, find the number of students speaking Marathi?
The chart shows the production of different vegetables in a farm. If the production of carrots was 20,500 kg, find the production of tomatoes.

A survey was done in a school to find the favorite colour of students. If 14,250 stundents like Red, find the number of students who like Green, from the following pie chart.

Is the following graph represents time vs temperature graph ?

The following graph shows the temperature forecast and the actual temperature for each day of a week.

What was the actual temperature in ° C in Thursday?
A courier-person cycles from a town to a neighbouring suburban area to deliver a parcel to a merchant. His distance from the town at different times is shown by the following graph.

Answer the following questions:
1). How much time did the person take for the travel?
2). In the above graph during which period speed was highest?
Following line graph shows the sales figure of a manufacturing company.

1). What was the sales in 2008?
2). For the above figure what was the sales in 2005?
As per the following graph what was the production of cement in the year 1960-61?

From the following graph determine the total distance travelled.

The graph below shows the hours Sarah worked each day of the week. On which day Sarah worked the most?

Following pie chart shows the percentage of viewers watching different types of TV channels.

What is sector angle (in degree) which represents the viewer of Informative channel?
On the bar graph below, how many days of rain were there in May?

The graph below shows the number of books a class read each month. Which month had the least number of books read?

Use the graph to answer the following question.

If a man covers 5 units right (due east) from point A, then find the co-ordinates of his new position?
Some children were asked to name their favorite flavor of ice cream. The following pie chart shows the information about their answers.

If number of children are 3600. Find the number of children who named strawberry as their favorite.
The following graph shows the temperature of a patient in a hospital, recorded every hour.

What was the patient's temperature in °C at 1 pm?
In an office there are 1200 employees . The following pie charts shows the mode of transportation of various employees of office for arrival to the office.

How many of them commute by bus?
The pie chart below shows the percentages of blood types for a group of 200 people.

How many people, in this group, have blood type AB?
CBSE Class 8 Maths Worksheet
Introduction To Graphs
Answers
10,250 Kg
19,000 students like Green
15 ° C
1). 3.5 Hours; 2). 8 am - 9 am
1). 12 crores; 2). 4 crores
80 tonnes
November
36.5°C
